
Data Analysis on Suicide using Tableau
Suicide is rampant nowadays. It is not unusual anymore for suicide to be the topic in the news. What factors then affect suicide rates? What are the trends in suicide numbers?
The data that was used for the study showed an overview of suicide rates by country from 1985 to 2016. It's comprised of 12 variables, namely: country, year, sex, age, suicide numbers, population, suicide/100k population, country & year, HDI for year, GDP for year, GDP per capita, and generation. The objective of the study is to see the trends in the data and to possibly determine the relationships of the variables.
To start the analysis, possible questions that may be answered given the data were identified first. The researcher determined that the following questions may be answered: (1) What are the top countries with the highest suicide rates? (2) Which gender has more recorded suicide numbers? (3) Is there a relationship between a country’s GDP and its suicide rates? (4) Is there a relationship between a country’s population and its suicide rates?
See full Tableau dashboards here.
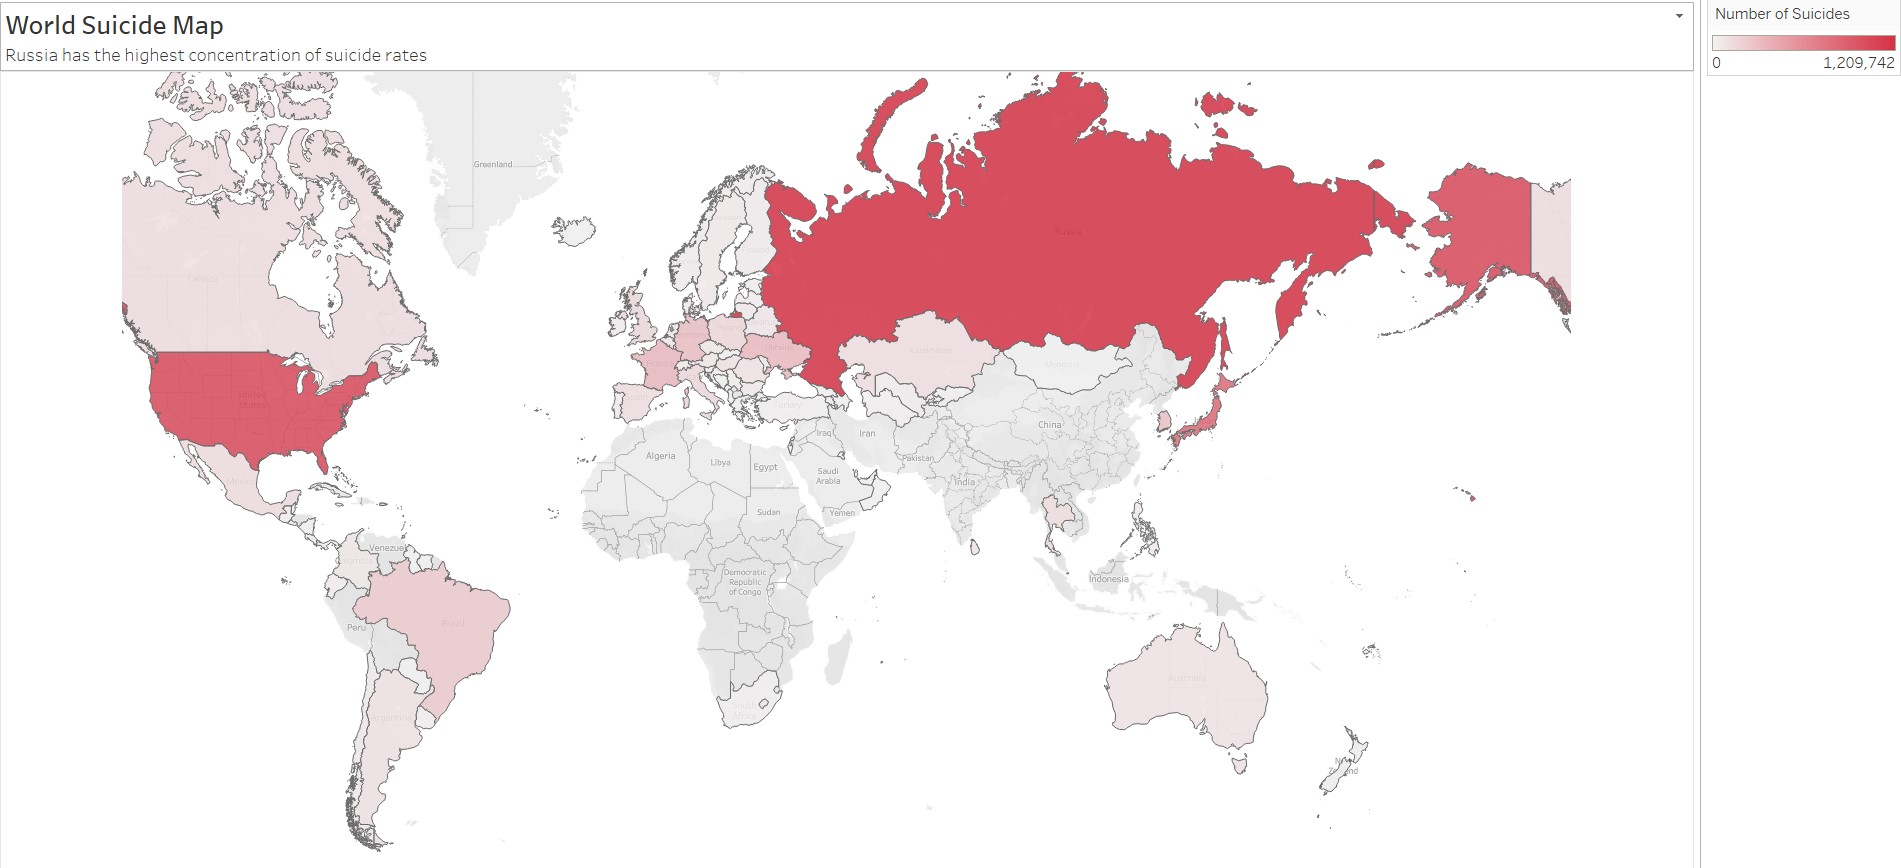
The researcher approached this study by analyzing the big picture first. Particularly, all the countries were mapped out and the concentration of suicide numbers were shown by leveraging the color red in the map, i.e. the deeper the shade of red shown in an area in the map, the greater the number of suicides recorded for that country (see figure above). Through this visualization, the countries with the most suicide rates were identified. On the map, the deepest shade of red was used for Russia, followed by the United States. On the other hand, lighter shades were used for countries with low suicide numbers such as Australia and the Philippines.
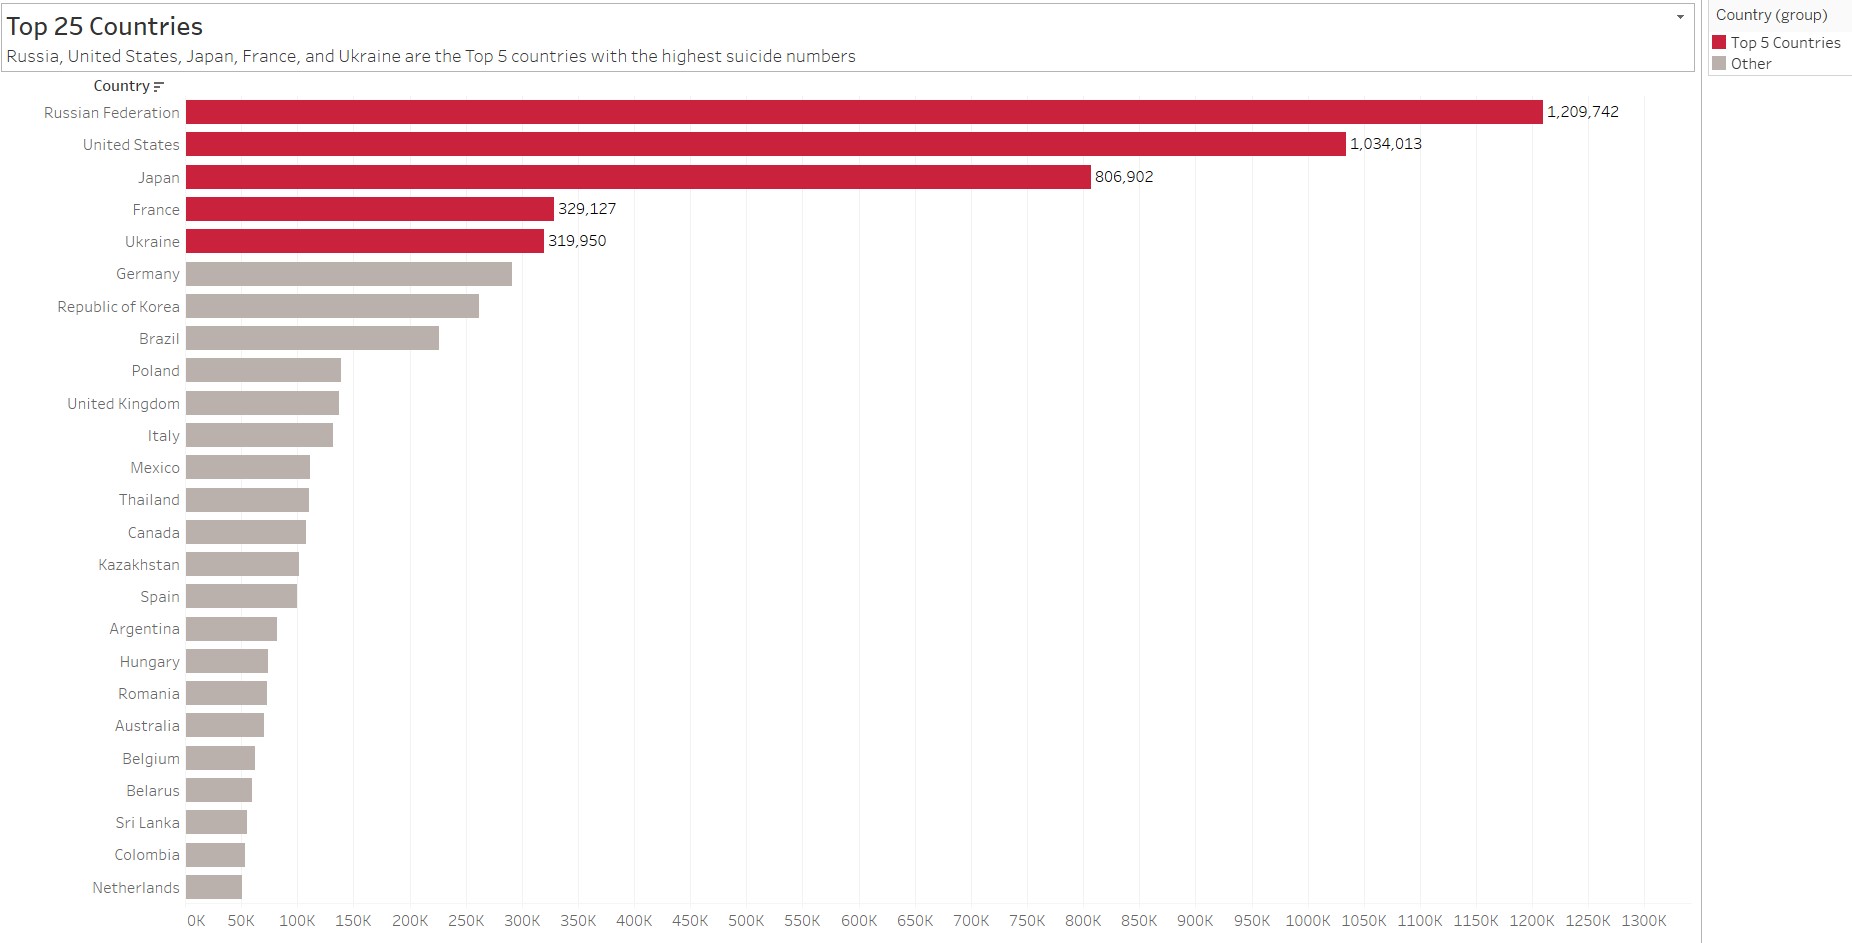
To make it even more clear, a bar graph arranged in descending order (see chart below) for the top 25 countries was created to rank the countries according to their suicide numbers. The top five countries were highlighted by changing the color of the bars to red while the color of the remaining bars or countries were changed to gray. Data labels were added to the top 5 countries’ bars as well so that exact figures of the data will be available to the readers. The chart showed that the top five countries are Russia, the United States, Japan, France, and Ukraine. Their suicide numbers are 1,209,742, 1,304,013, 806,902, 329,127, and 319,950, respectively. It can be seen that the difference of the suicide numbers of the top 3 countries compared to the other countries are significant.
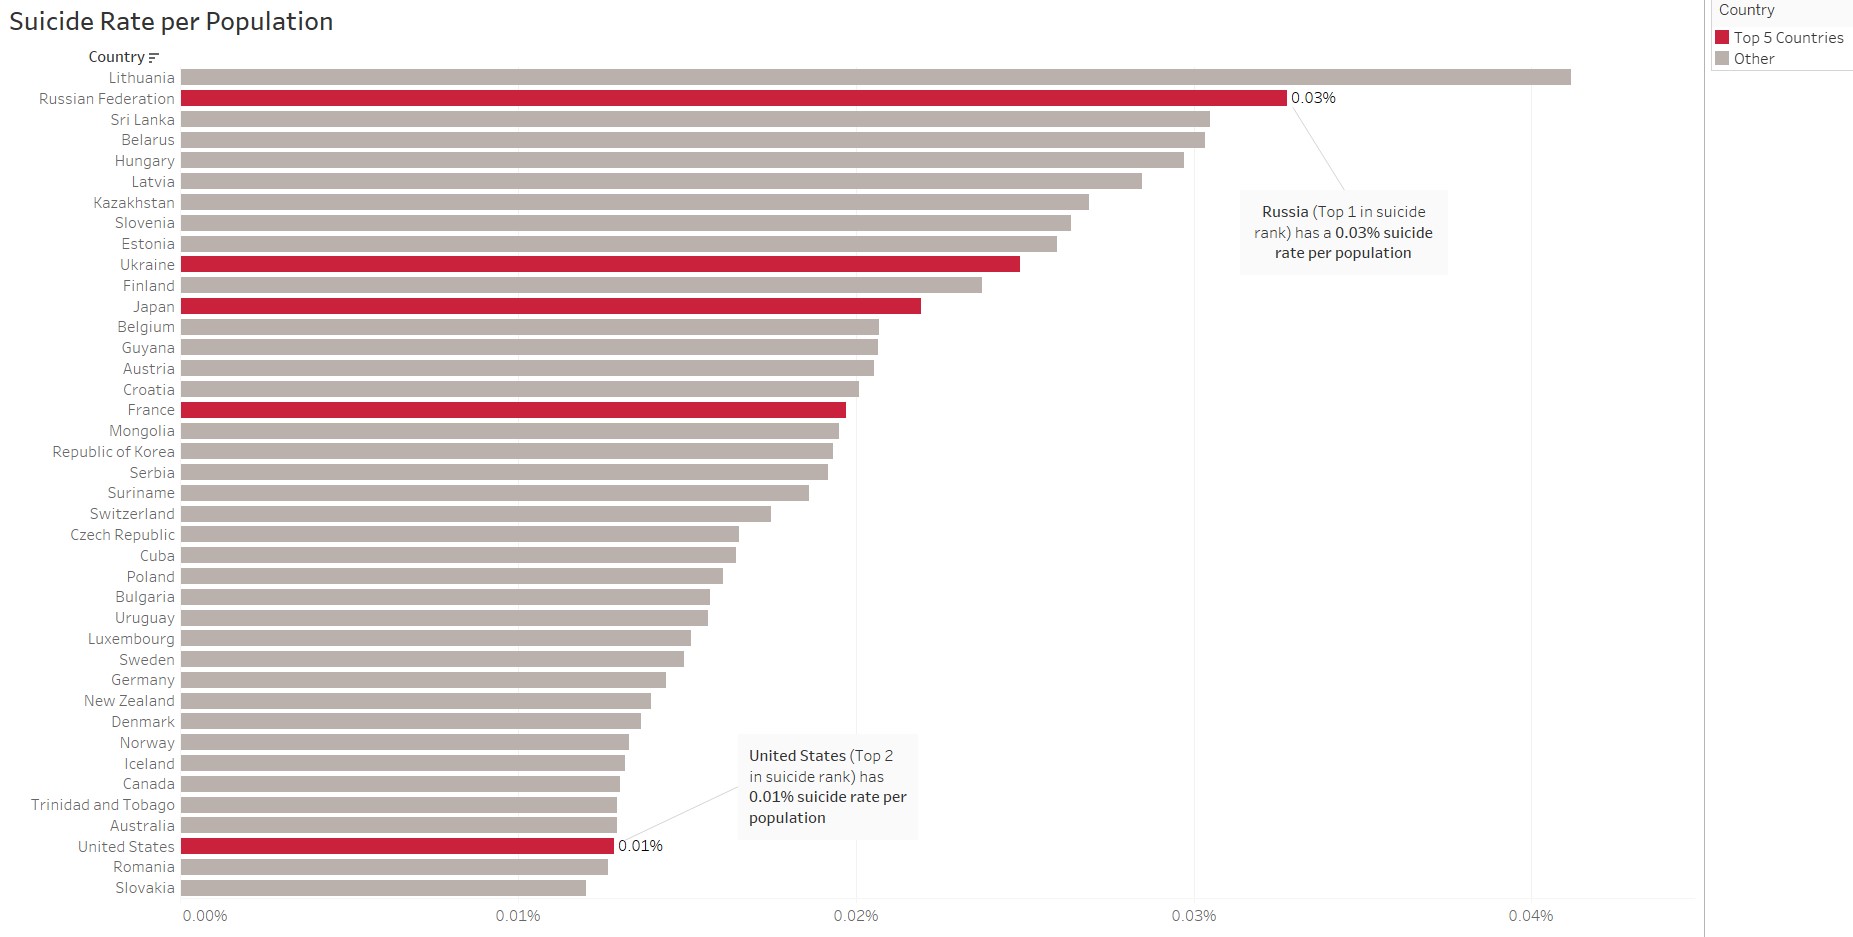
In addition, the researcher wanted to see if there is an association between a country’s population and its suicide rates. A country’s suicide rate per population was computed by dividing the suicide numbers of a country by its total population. A bar chart (see below) was used to visualize the results of this analysis and the top 5 countries’ (Russia, US, Japan, France, Ukraine) bars were highlighted to narrow down the focus of the study. Intuitively, the bigger the population, the higher the suicide rates. This was the case for Russia that generated a 0.03% suicide rate per population. However, the United States who ranked second with regards to its suicide numbers only had a 0.01% suicide rate per population. This is less than the suicide rates per population of Ukraine, Japan, and France, who ranked fifth, third, and fourth, respectively. Hence, there is no clear connection between a country’s population and its suicide rates.
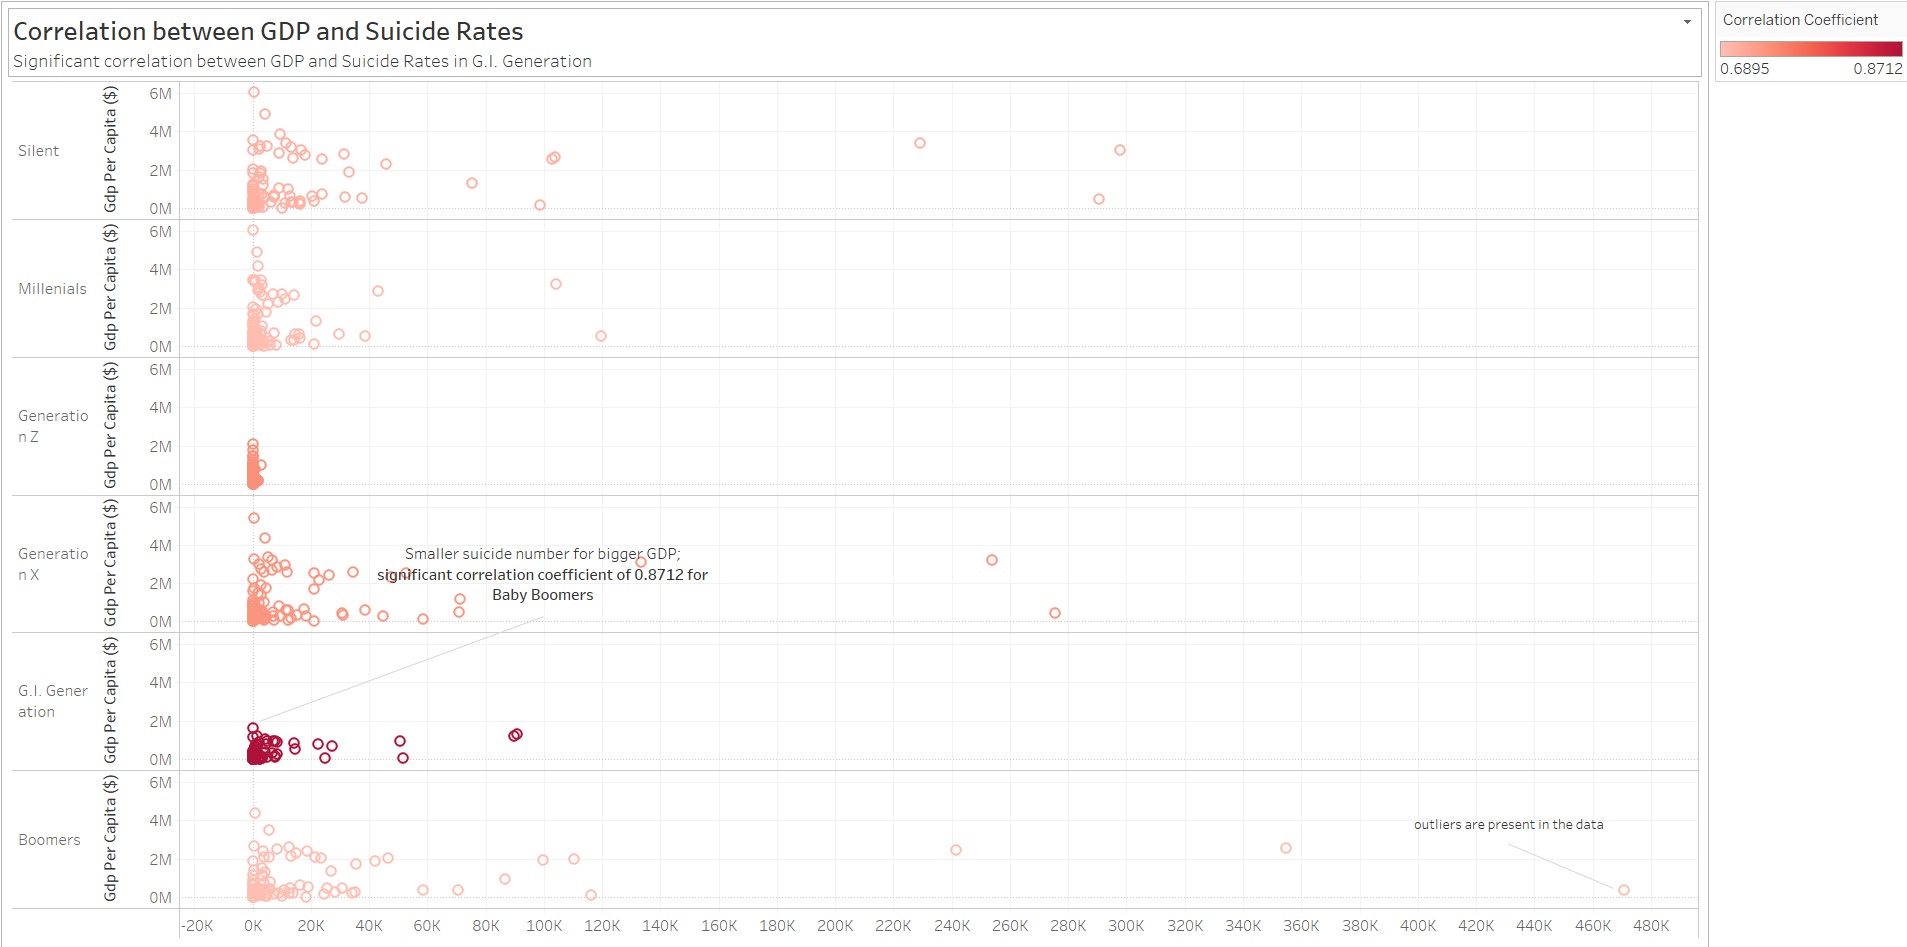
Further, the study also aimed to determine if there is a relationship between a country’s GDP and its suicide rates. The researcher computed for correlation coefficients for the countries and narrowed down the analysis by incorporating the different generations of the country’s citizens such as Millennials, Generation Z, G.I. Generation, Boomers, and Silent. The chart generated (see below) showed deeper shades of red for bigger correlation coefficients, and it revealed that there is a high correlation between a country’s GDP and suicide rates in the G.I. Generation. The computed correlation coefficient equaled to 0.8712. Intuitively, it can be claimed that countries with bigger GDP have lower suicide rates. This is exhibited by countries such as Luxembourg with GDP per capita of $1.6 million and Iceland with $1.1 million, and suicide numbers of 231 and 76, respectively. However, the chart also reiterated what was stated earlier in the study, that there is a big difference between the suicide rates of the top 3 countries (Russia, US, Japan) compared to the other countries. Hence, there are outliers in the data.
To further narrow down the analysis of the study and see other trends, the researcher decided to examine the data pertaining to the United States. The line chart below was produced to see the trend of the average number of suicides in the United States for the last five years. Line charts were created for the top 5 countries but the opacity of the other four countries were changed so that focus would be directed to the United States. The figure showed that the average number of suicides for the United States in the last five years is increasing. In 2015, the figure has reached an average of 3,682. This is fairly big compared to 2,119 of Russia or 1,924 of Japan.

Moreover, to show the variation in United States’ historical data on suicide numbers, a waterfall chart was created (see below). Bars going downwards visualized how the difference in suicide numbers decreased while an upwards bar demonstrated an increase in suicide numbers. Color was also leveraged to highlight the years with bigger numbers of suicide. The results showed that in 1999, the number of suicides decreased significantly by 1,375 while in 2014, the number of suicides increased by 1,626.

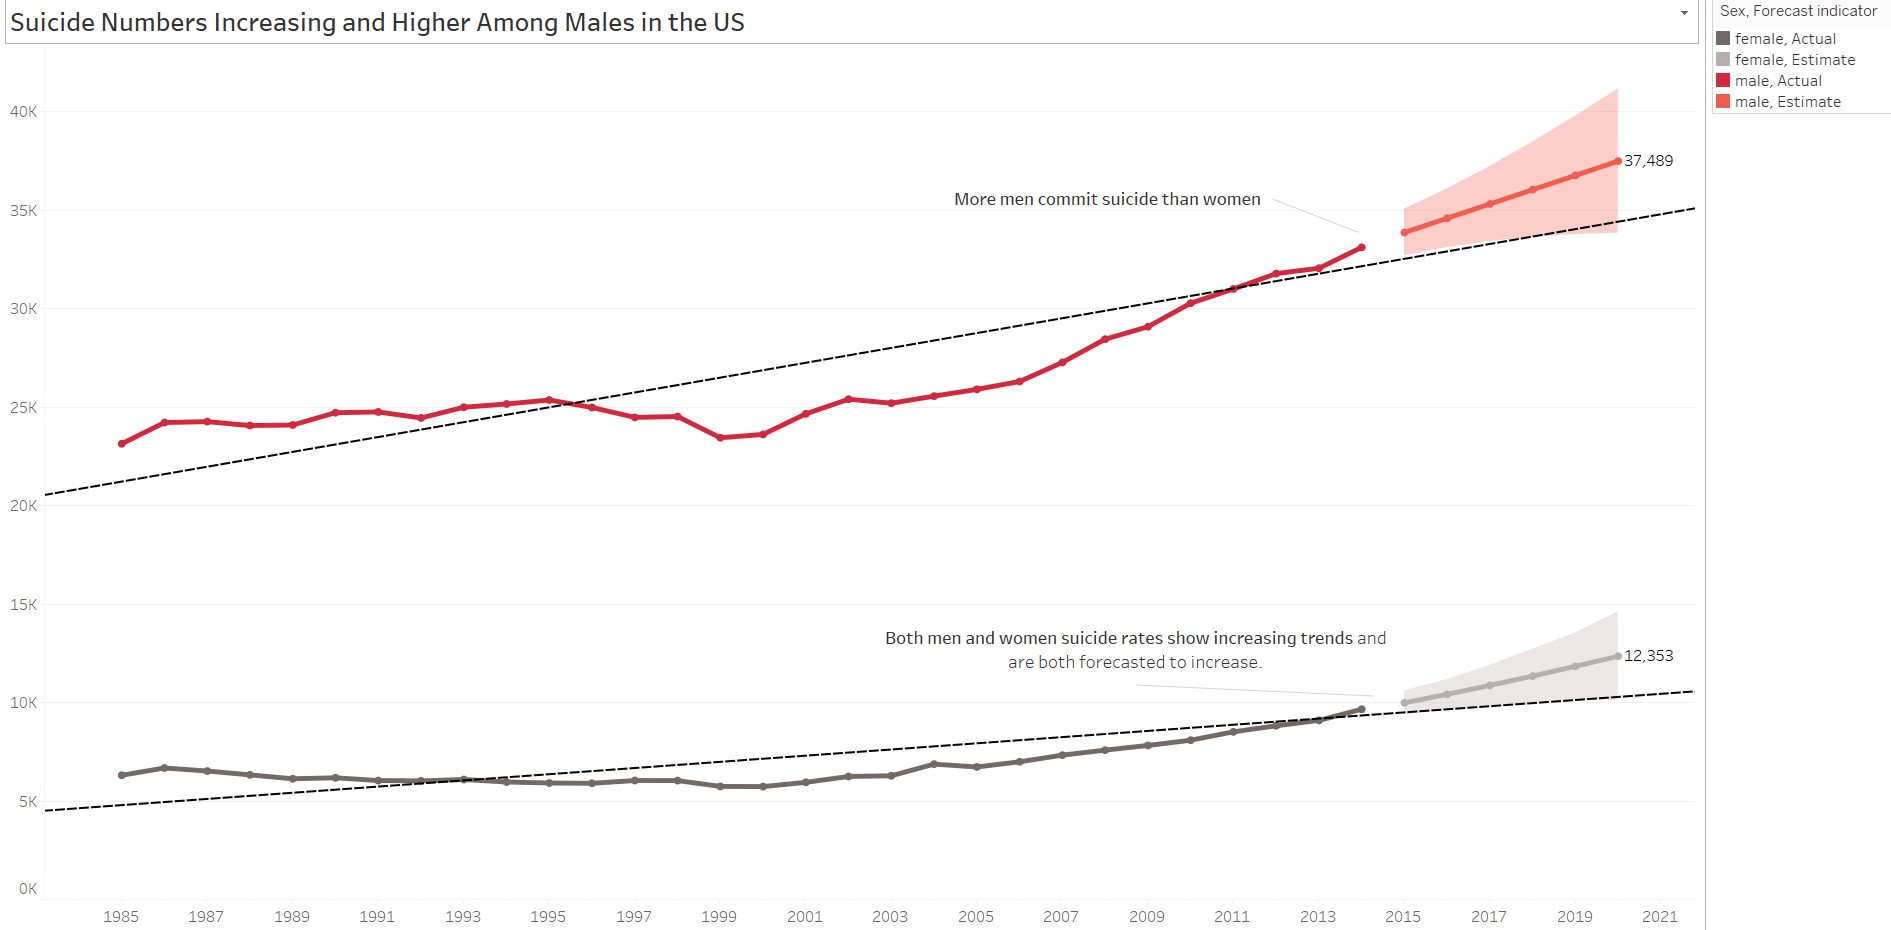
Additionally, the researcher wanted to analyze other aspects of the data such as the gender of the citizens. A line chart was produced to show the difference in men and women suicide numbers. The chart revealed that more men commit suicide than women. To emphasize this, the color of the line for men was changed to red and an annotation was also added. Further, the researcher also wanted to show the increasing trend in the data for both men and women, so trend lines were added. The trend lines proved to be significant with a p-value less than .05 and a strong r-squared value of 0.8 for men and 0.7 for women. Lastly, forecasted values were generated and data labels were added to show these values. Thus, in 2020, suicide number for men is expected to increase to 37,489 while the suicide number for women is expected to increase to 12,353.
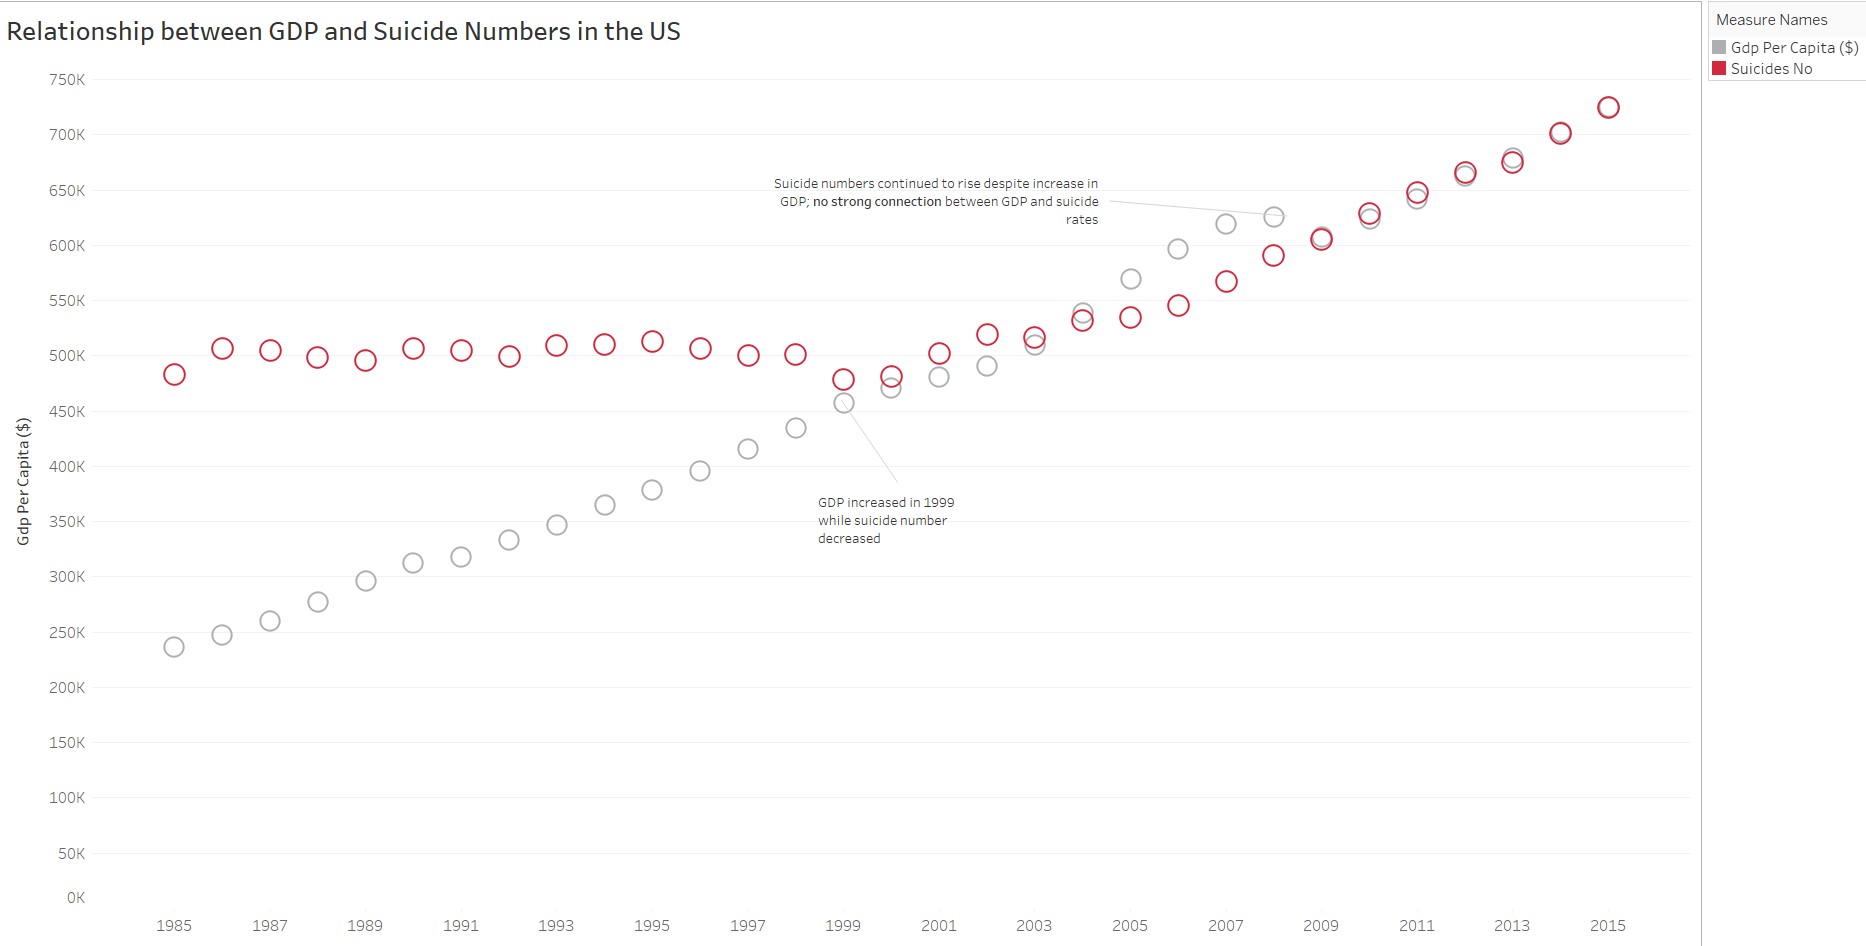
Likewise, the researcher wanted to analyze the relationship between the United States’ GDP and its suicide numbers. Color and annotation were used to make the data more understandable. The chart shows that there were times wherein suicide numbers would fall if GDP increased; however, there were also instances wherein a continued rise in GDP didn’t bring upon a decrease in suicide number. Thus, there is no apparent association between the United State’s GDP and suicide numbers.
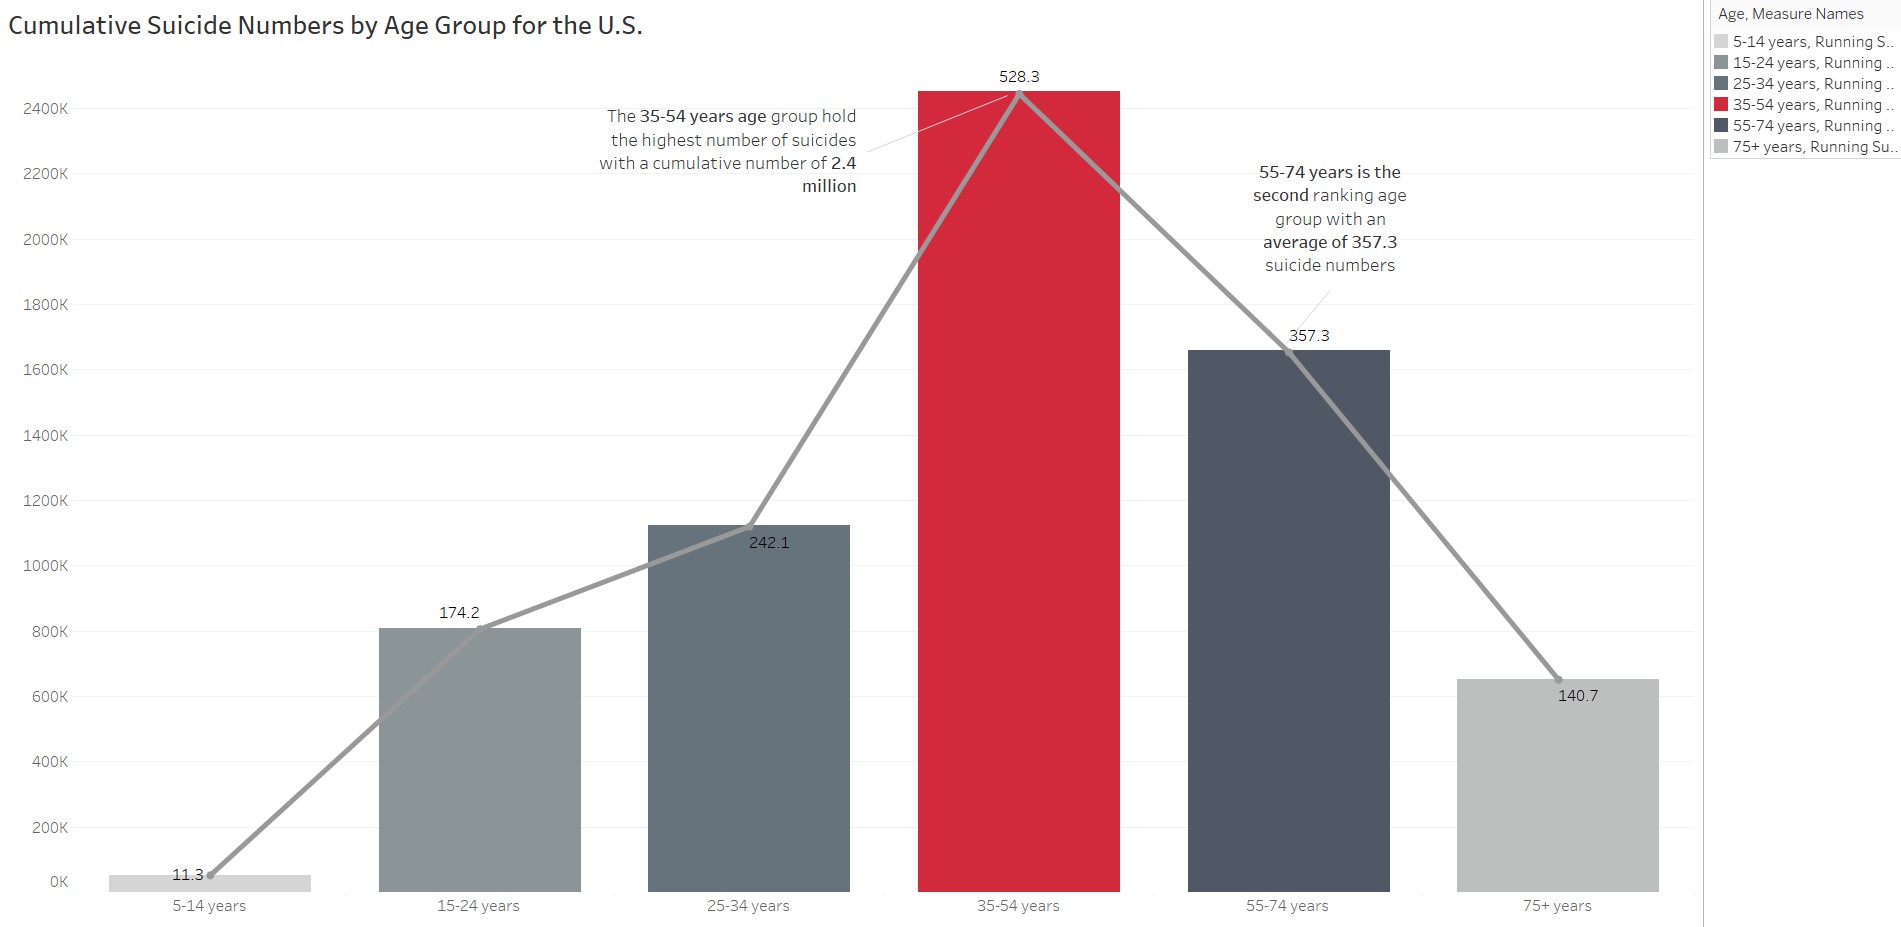
Lastly, the cumulative number of suicide numbers by age group was examined. A bar chart was used to visualize this, and a line chart was also added to show the average number of suicides. The color of the bar showing the highest number of suicides recorded by the age group was changed to red so that it may be highlighted, while the other bars were changed to different shades of gray, relative to the number of suicides. Annotations and data labels were also added to make the visual more clear. The chart revealed that the 35-54 years age group have the highest cumulative number of suicides at 2.4 million, followed by the 55-74 years age group with an average of 357 suicide numbers.
Ultimately, the study was able to answer the questions stated earlier. The top 5 countries with the highest number of suicides were revealed to be Russia, United States, Japan, France, and Ukraine. In addition, the analysis showed that more men commit suicide compared to men. With regards to relationships of the variables, on one hand, the study was able to show that there is a significant relationship between GDP and suicide rates for most of the countries. However, there are outliers in the data such as the case of the United States so not all countries demonstrate the relationship between GDP and suicide rates. On the other hand, with regards to the relationship of population and suicide numbers, the study was not able to show a strong correlation between the two variables. In the future, other perspectives may be explored so as to give more insights on the data. Other factors that may lead to suicide may be examined as well as the ways one commit suicide may be analyzed.
See full Tableau dashboards here.
Data source: Kaggle